OSS GitHub organizations monitoring
For the past couple of years I’ve been working on and off on Dashing, it’s a set of dashboards to monitor an open source organization’s health on GitHub.
At the moment, it mines historical data on GitHub regarding stars and pull requests. Let’s go through each dashboard!
Dashboards
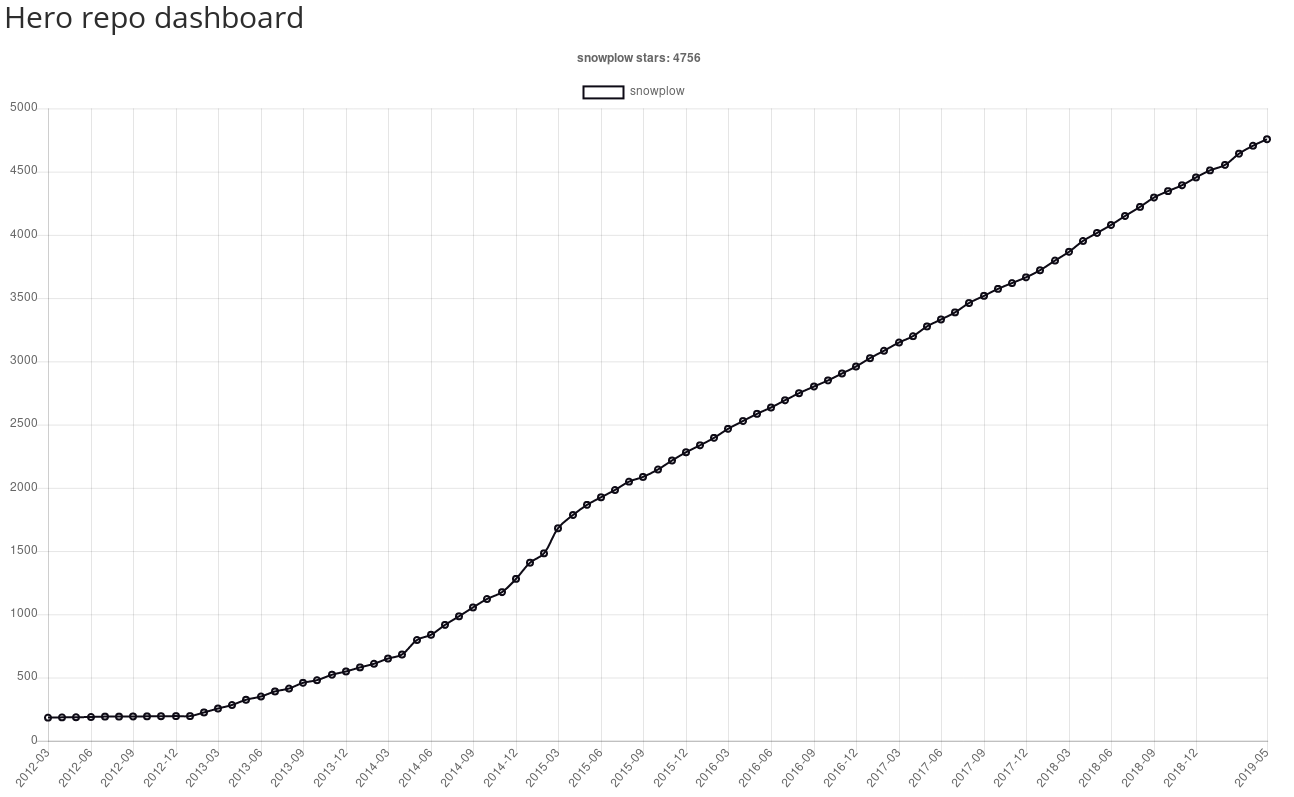
The hero repository dashboard display the evolution of the number of stars along a time axis for a particular repository that you consider to be the “main” repository for your organization.
Here, we can see the evolution of the popularity of snowplow/snowplow:
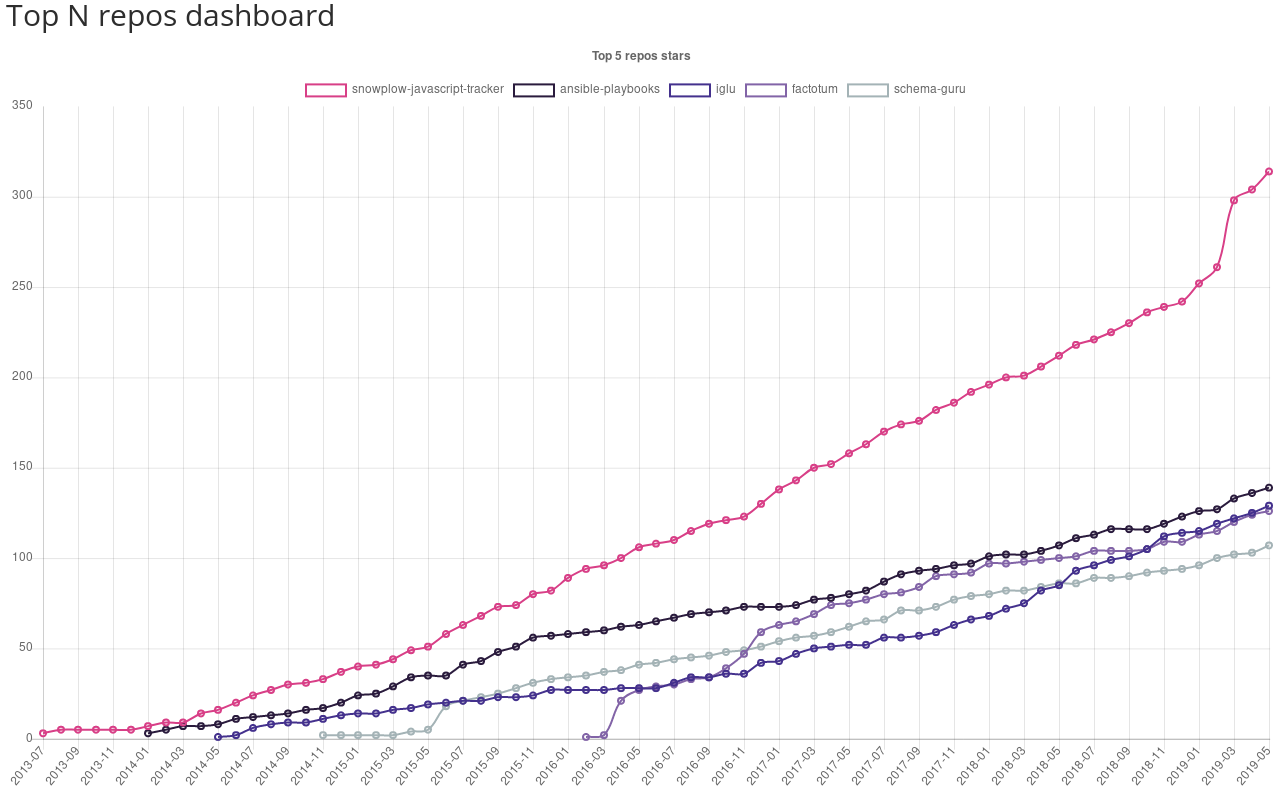
The next dashboard show the evolution of the number of stars for the following n repositories in
terms of popularity.
Here, we can see the evolution of the popularity of the 5 most popular repositories in the
snowplow organization. snowplow is excluded as we considered it to be the hero repository.
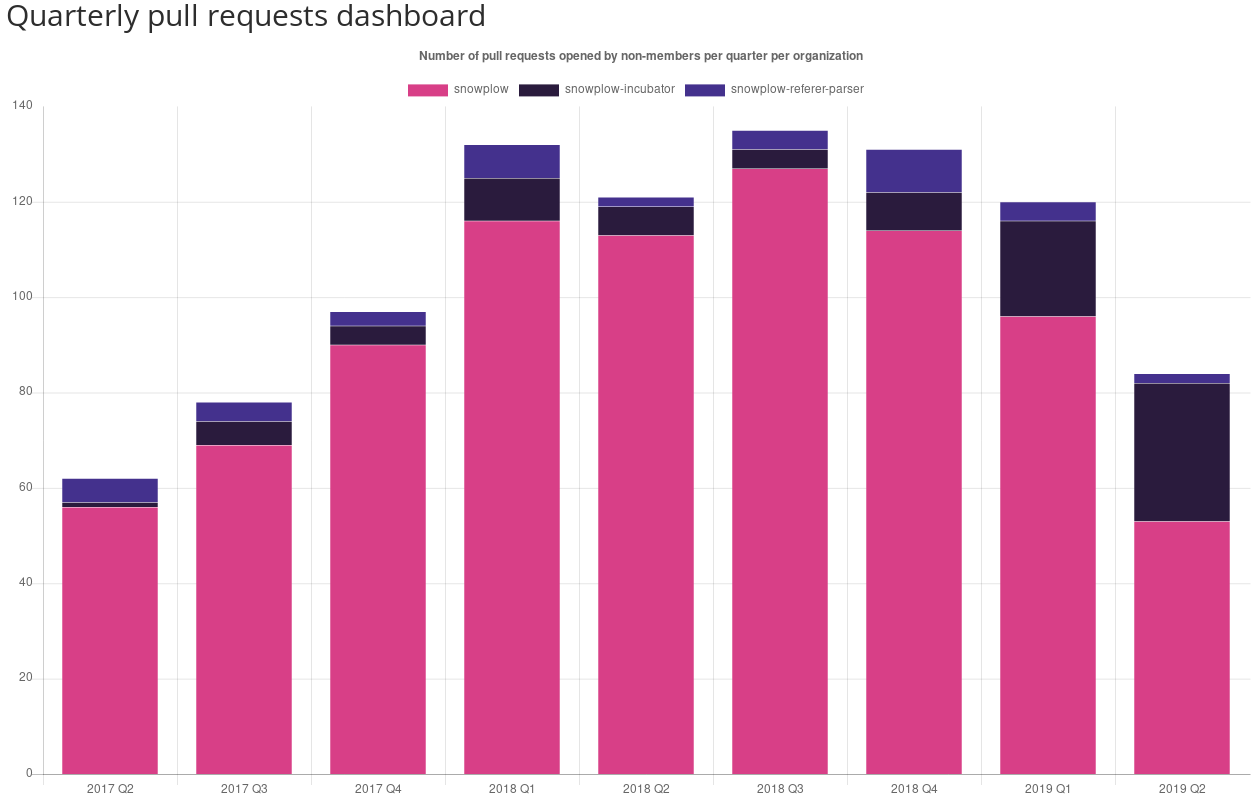
The other two dashboards focus on actual contributions by measuring the number of pull requests opened by people outside the organization across multiple organizations.
The first one does so quartlery. Here, we explore the pull requests opened by people outside the Snowplow organizations: snowplow, snowplow-incubator and snowplow-referer-parser.
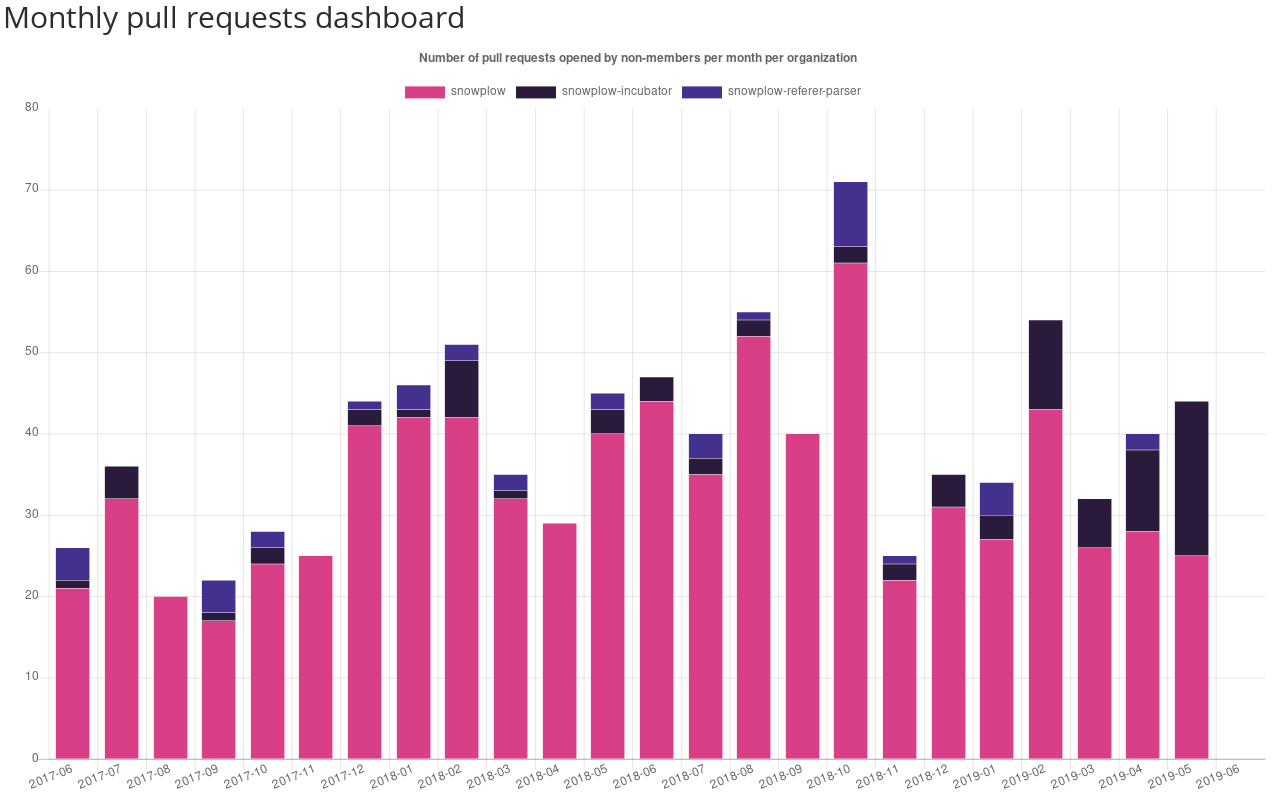
The same data is also available monthly.
Software stack
The backend is built using http4s with circe for JSON manipulation.
On the frontend, the app uses scalajs-react and chartjs for the dashboards themselves.
Running
To run the project yourself you’ll need to fill a configuration file:
# Github access token
ghToken = token

# Configuration for the dashboards about pull requests
prDashboards = {
  # Github organizations from which to retrieve the data regarding pull requests
  orgs = [ snowplow, snowplow-incubator, snowplow-referer-parser ]
  # List of github handles to ignore, for example if they're wrongly not part of the org
  peopleToIgnore = [ "jorgemgoncalves", "three", "asoltysik" ]
  # How far in the past the GitHub pull request data lookups should go
  lookback = 730 days
}

# Configuration for the dashboards about stars
starDashboards = {
  # Github organization from which to retrieve the data regarding stars
  org = snowplow
  # Name of the most popular repository for the hero repo dashboard
  heroRepo = snowplow
  # Number of most popular repositories to analyze (hero repo excluded)
  topNRepos = 5
}

# Duration for which data from GitHub is cached
cacheDuration = 12 hours

# Host the server should bind to
host = localhost

# Port the server should bind to
port = 8080
Once the configuration is filled up you can start the app with:
$ sbt
> project server
> ~reStart
At the moment, you can only package the application using sbt-assembly. I’ll be working on a proper docker image soon.
Conclusion
Of course, the set of dashboards is, at the moment, quite limited. Future dashboards could include pull requests response and merge times and statistics around issues which haven’t been explored yet.
Dashing was originally meant to be a toy project to try out Scala.js because I had never done any frontend development before (as the project shows), there is a lot that can be improved in that regard.
As a result, I would gladly welcome any contributions on frontend-related improvements (of course any improvement is definitely welcome!).